

Let's target 35% electrification, but of what?
The co-presidents of COP 31 have announced a target of 35% electrification as a percentage of Final Energy. Electrification is the right target, but percentage of Final Energy is the wrong metric.

Chris Bowen, Australia’s Minister of Climate Change and Energy, who will be co-President of COP31 in Ankara later this year alongside his Turkish counterpart Murat Kurum, speaking at the opening plenary of a preparatory meeting in Bonn yesterday, announced a target for electrification of 35 by 35: electricity to make up 35% of Final Energy by 2035.
His focus on electrification is enormously welcome. The target of electricity as a percentage of Final Energy however, is problematic. A much better metric would be electrification by major sector, or electrification as a percentage of Useful Energy.
Electrification is everything
Everywhere I have been this year, electrification is in the air. In Canada it was the sujet du jour, in Germany the Thema des Tages. Brussels is working out the details of the Electrification Strategy announced by Ursula von der Leyen. The UK, Paris, Berlin are all powering up.
I’m delighted. I’ve been sparking off about electrification for years, alongside people like Saul Griffith, Kingsmill Bond, and quite a few others. This year, I was one of the authors of the Electrification Staircase, a simple graphic showing which applications should be easiest to electrify, published by the Electrification Alliance. In April we released an episode of Cleaning Up on the Electrification Staircase. One of the reasons I was so vocal about the Hydrogen Economy nonsense was that it stood in the way of discussion about the benefits and challenges of electrification.
The opportunity is enormous. Space heating, land transportation and low/mid-temperature industrial heat together account for over 40% of global emissions, and there are plenty of electric solutions at or near cost parity. They should be the focus of everyone’s attention. I have described what we face as a smorgasbord of options; once your electricity is “clean enough”, it makes far more sense to gorge yourself on the smorgasbord than to pick away at the carcass of perfectly clean power at any cost (as explained here in the Thoughts of Chairman Michael and here in my Pragmatic Climate Reset, Part II).
Electrification is also the best route to a long-term reduction of exposure to the current fossil fuel crises (and the ones which will inevitably follow it), and it holds the key to international competitiveness.
This chart has been doing the rounds at conferences and on social media for the past two years, ever since being showcased in an RMI article entitled The Race to the Top in Six Charts and Not Too Many Numbers in July 2024:
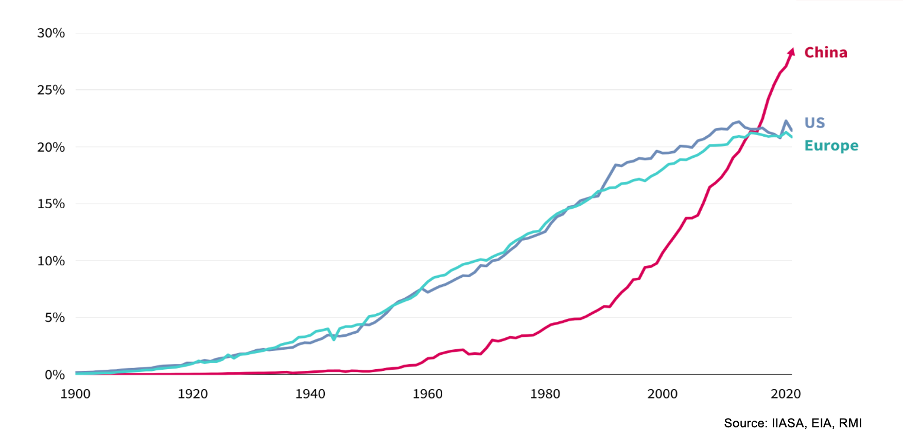
It shows China soaring ahead of the US and Europe. Europe and the US were electrifying 4% of their respective economies per decade between 1950 and 2010, but they then stalled. China, by contrast, started from far behind the US and Europe, but now leads and is pulling away, after electrifying 10% of its economy per decade for past two decades.
(Before you head for the comments, it’s not that we need to “electrify everything”, but if you want to see deep, rapid and affordable emission reductions, you can honestly say “electrification is everything”.)
The Final Energy Fallacy
So what’s wrong with using electricity’s share of Final Energy as a metric?
After all, 35% electricity in Final Energy sounds similar to reaching 35% penetration of electric technologies, or 35% electricity in the energy used to drive our economy. But dig into the numbers and you’ll see that it really isn’t the same. Not at all.
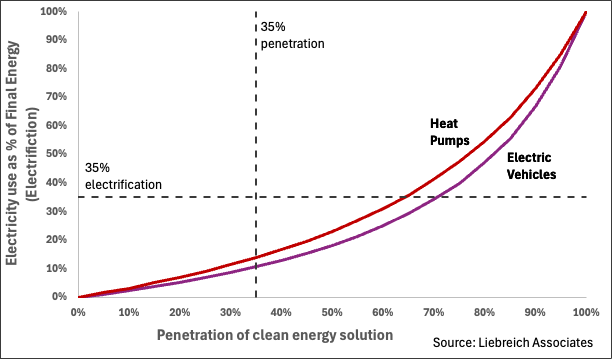
As you electrify, particularly with EVs and heat pumps, both numerator and denominator change. In fact, since each unit of electrification can reduce Final Energy by three or more units, the main mathematical effect is not the increase of the numerator but the reduction of the denominator. As a result, when you first start to electrify, the metric barely moves; then, as electrification progresses, it curves up, and finally soars, as can be seen in the chart at the top of this article.
Take the example of road transport. When you reach 35% EV penetration, you have only electrified around 11% of the sector’s final energy (the exact figure will depend on the relative efficiency of EVs and fossil-fuelled vehicle).
It’s the same with heat pumps. By the time 35% of your space heating is done by heat pumps with a Coefficient of Performance (COP) of three, you will only have reached 14% electrification as a percentage of final energy.
The oddity arises because Final Energy is not energy demand. It is the energy content of whatever is sold to end users, so it includes energy wasted by the user. (In fact, Final Energy is only final from the perspective of the energy sector, just as Primary Energy Demand is only demand from perspective of the energy sector, not the real economy.)
When you buy petrol or diesel for your car, its entire energy content is counted as Final Energy. But only around 20% of that energy actually goes into pushing the car forward – that is the so-called Useful Energy. In the case of an EV, by contrast, up to 90% of the energy contained in the purchased electricity moves the car, what with regenerative braking.
When you switch from an internal combustion vehicle to an EV, the amount of Final Energy drops by around 80%. Same with heat pumps. You’ve heard of the Primary Energy Fallacy; think of this as the Final Energy Fallacy.
An example. Say you own two fossil-fuelled cars, each doing the same number of miles, and each using 100 units of Final Energy each week. Your Final Energy use is 200 units per week; your Useful Energy – the bit that actually moves the car around – is 40 units.
Now you swap one of them for an EV. In any rational view of the world, you have achieved 50% electrification. But what is your electricity use as a percentage of Final Energy? The fossil-fuelled car still uses 100 units of Final Energy to deliver the 20 units of Useful Energy required to drive around; the electric one is so much more efficient that it only requires 22 to produce the same amount of Useful Energy and drive the same number of miles. You have electric consumption of 22 units out of total Final Energy of 122 units, and your electrification as a percentage of Final Energy is 22/122, or only 18%.
Another example. Say you have two identical houses, both heated with gas, each accounting for 100 units of Final Energy. Now you install a heat pump in one of them. Quite obviously you are 50% electrified. But because the heat pump achieves a Coefficient of Performance of three, you only need to buy 33 units of electricity for that house. Your Final Energy has dropped to 133 units, and your electricity as a percentage of Final Energy is 33/133, or just 25%.
TLDR – the nerdy bit
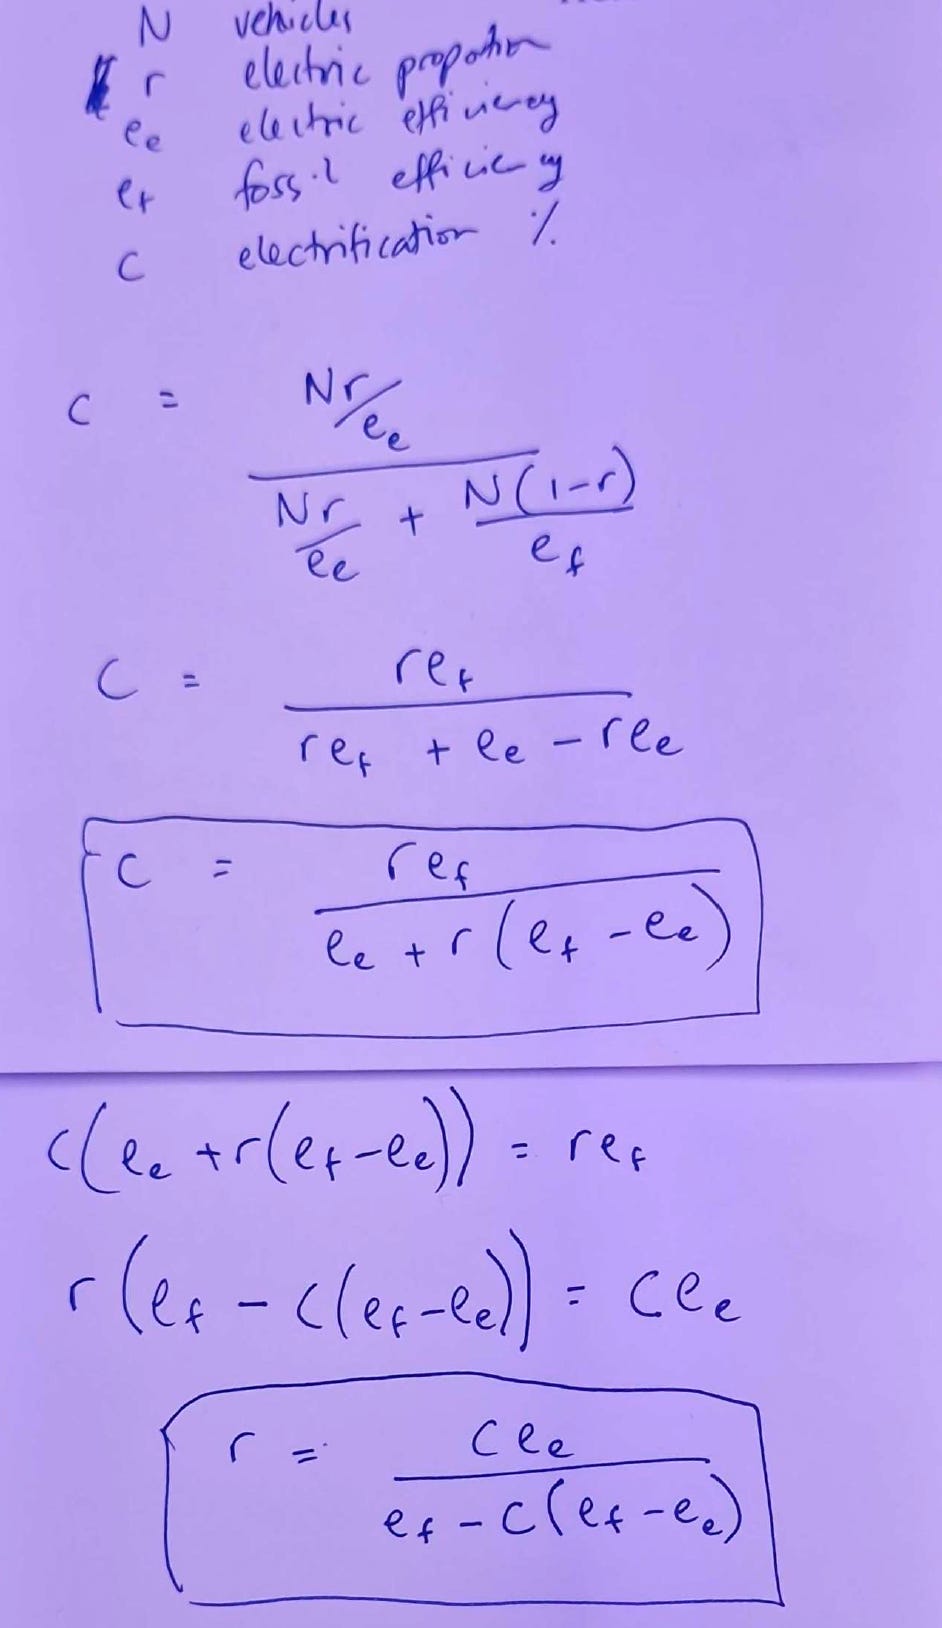
It’s very easy to create a spreadsheet with three inputs – efficiency of the electric solution, efficiency of the fossil solution and penetration – which spits out electrification as a percentage of Final Energy. Then you can use goal-seek to find the penetration of clean technologies needed for any given level of electrification as a percentage of Final Energy.
If you think of goal-seek as cheating, you can derive an equation linking efficiencies, penetration and electrification as a percentage of Final Energy, and vice versa. Over the weekend, travelling back from three weeks in Singapore, Australia and New Zealand on behalf of Cleaning Up, I got stuck for an hour at Wellington Airport with no wifi. Luckily I had an envolope and a pen:
My friend Marco Möller, CEO of charging software company Pionix, also loves a good equation. He posted about the same dynamics recently on LinkedIn, which is in part what got me thinking, though he was using electrification as a percentage of Primary Energy, not Final Energy.
The point Marco made was that if you think the early stages of electrification will be easy – low hanging fruit – and the later stages hard, the reality is that it will be the other way round. He was not wrong, but my takeaway is different: if we use the correct metric, penetration of clean technologies, rather than electrification as a percentage of either Primary or Final Energy, we strip out the weird mathematical artefacts and reveal perfectly familiar and well-understood sigmoid (slow-quick-slow) S-curves.
Back to the targets
Don’t get me wrong, I am all-in on electrification. And I absolutely understand the attraction of having a single, easy-to-communicate metric, like 35 by 35. However, if a target can’t be translated into actionable, plausible, achievable goals by sector and country, what use is it?
At some point, for instance, countries will realise that to get to 35% electricity as a percentage of Final Energy in transport would require 70% of vehicles on their roads to be EVs by 2035. This will be mathematically impossible for most countries, given that just under half of the cars that will be on the road in 2035 have already been bought.
In fact, Norway is a great illustration of the problem. In 2025, 96% of all car sales were EVs (most battery-electric, a few plug-in hybrids). If you look at the fleet, they are at around 35% electric cars today.
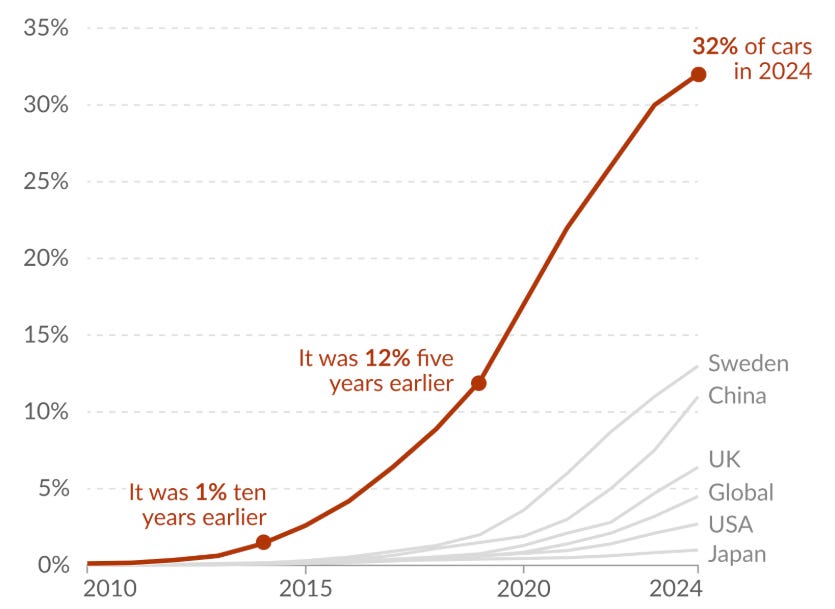
However, because the 65% ICE cars are so much less efficient than EVs, the electricity used by EVs in Norway only accounts for 14% of the sector’s Final Energy (even after adjusting for the fact that Norwegian EVs do 36% more miles than ICE cars).
If Norway’s extraordinary uptake of EVs over the past decade can’t even reach half-way to the target of 35% electric share of Final Energy, how can we expect the target to motivate any other country?
A call to action - we need data on Useful Energy
There is nothing wrong with the slogan 35 by 35. It just can’t be applied to electricity’s percentage of Final Energy. Instead, for instance, countries could agree that wherever there is a commercially viable electric technology, they will target 35% penetration by 2035 (which would require getting to extremely high percentages of sales of the relevant technology).
Alternatively you could frame the target as a percentage of Useful Energy, though then 35% is not very ambitious. And the data to measure performance against the target does not exist.
One of the things this exercise has reinforced, for me, is the urgent and intense need for robust data on Useful Energy. It is Useful Energy that powers our economy, not Primary Energy and, as we have seen, not Final Energy either. Yet we have no up-to-date, authoritative data on Useful Energy. It’s frankly scandalous.
None of the major national or multilateral energy agencies provide the data you would need to answer basic questions like “what percentage of the heat that keeps homes warm in country X is fossil direct, fossil electricity, clean electricity, or harvested from the environment”. You can use their data to calculate it yourself, but you need to do your own spreadsheet, and your figures will carry no authority.
We are nearly a third of the way through the most consequential energy transition in history, and the metrics being used by the energy sector, investors and ministries tell us everything about where energy comes from and nothing about how it is used.
We are flying blind.
IIASA has done the exercise in the past, but its Primary, Final and Useful Energy Database (PFUDB) terminates in 2014 and does not appear to have been updated since. A team at Leeds University led by Professor Paul Brockway produced a country-level primary-final-useful (CL-PFU) energy and exergy database covering the years 1970 to 2020. But neither of these is sufficiently up-to-date to reflect this decade’s growth in clean solutions. And neither has authority.
Useful Energy cannot be counted as easily as lumps of coal or gallons of petrol – there are judgements involved. Is the Useful Energy of an AI data centre the minimum quantum thermodynamic requirement of the compute, is it the power drawn by all the GPUs, or does it include some allowance for cooling? Useful Energy also changes over time as solutions become more efficient. In the past, you might have had to boil-wash sheets; with modern detergents you can wash them at 60C or below and with much less water, enormously reducing the Useful Energy associated with laundry day.
What is needed is an authoritative and generally accepted list of Best Available Technologies by sector and region. The decisions on what constitutes Best Available Technology need to be robust, transparent, peer-reviewed, up-to-date, and be published by an agency of unimpeachable independence. The IEA’s Energy End-Uses and Efficiency Indicators database is updated annually and is very similar to a list of Best Available Technologies, but it is not currently used to produce a comprehensive Useful Energy data set.
It is surely time for its member countries to call on the IEA to produce the definitive Useful Energy data set as part of its WEO report - and not as a one-off but annually.
Authoritative figures for Useful Energy - overall, by sector and by country - would enable decision-makers to make informed choices about how to pursue decarbonisation, sector by sector, country by country.
Such figures would also allow our leaders to set meaningful, challenging, achievable, clear targets for electrification within the UNFCCC process. Until then, we’ll just have to muddle along, knowing that the direction, at least, is correct.
Cat, meet pigeons.
Thanks Michael. So, if you set yourself, or your country, a goal of increasing electricity as a percentage of Final or even Useful Energy, it becones rational to mandate the least efficient heat pumps and EV's. Quirky detail of the cleantech revolution indeed :)
I loved the post. I have been ranting myself about how people are confused about the importance of energy efficiency in the transition - electrification and renewable energy drive the numbers everyone sees, but people then take these numbers as a mandate to push very hard on building insulation and avoiding air conditioning, or even trips in EVs.
I am going to go ahead and disagree with the tong in cheek, half serious call for useful energy. The right approach, I think, is sectoral targets. Understandable and operational enough. I don't think my hairdresser needs to know what useful energy is. But they definitely should know what EVs and heat pumps are.